Other
Cryptocurrency Trading Patterns for Investors

Technical analysis patterns are formed using the simplest graphical analysis tools, namely levels and resistance and support lines. This is the first thing every trader got to remember. There is no magic, only work with key levels.
Graphical analysis is based on one of the tenets of technical analysis that history repeats. Of course, there cannot be two completely identical models since real people trade in the cryptocurrency market. Therefore, the fluctuations in the formation of the same pattern may differ.
History repeats
All the figures of graphical analysis in the cryptocurrency market tend to repeat. They have common features that allow classifying and separating them into shapes. Take, for example, an ordinary isosceles triangle formed from two trend lines that gradually meet.
The triangle size can be different, the angle of trend lines convergence can vary as well. Even the period of the triangle’s formation can vary in different patterns. But the main thing is that two converging trend lines can be drawn on the chart.
Besides, the presence of at least two waves is a specific feature of the triangle. If these conditions meet, we conclude that we see such a pattern on the chart.
Technical analysis patterns
Technical analysis patterns are a kind of alternative to algorithmic analysis that works with indicators. Although many traders use both forecasting methods to succeed.
List of main figures
- Spike
- Doji
- Diamond
- Rectangle
- Head and shoulders
- Saucer
- Cup and handles
- Three Indians
- Pinocchio
- Triangle
- Tops and bottom
- Wedge
- Pennant
- Flag
- Gap
- Japanese candlestick patterns
Benefits of technical analysis patterns
Graphic analysis has both its adherents and opponents. And this is quite normal since not everyone can estimate the benefits of using this forecasting method results. Here are the main pros and cons of using the forecasting method for you to understand whether it worth your time and effort.
Advantages of technical analysis figures
Analysis without extra tools. Chart patterns can be found on a chart using only trends and levels. No extra tools are needed.
Visibility. When a trader learns to recognize graphical analysis patterns well, one becomes able to find them at the stage of formation. This allows getting certain advantages, like knowing the best time to convert LTC to BTC.
Clear rules for the formation of figures. This is another important advantage of technical analysis patterns. Each model has clear rules for generating and receiving signals. Knowing these rules, the trader will act accordingly to the situation.
Disadvantages of technical analysis figures
Unfortunately, technical analysis figures don’t always play into the hands of a trader, especially beginners. Two traders can see two different patterns on the same chart and time frame. Each trader has a different view of the market.
Many professional traders recommend avoiding following the patterns during their formation. This makes sense since any pattern precedes a strong impulse or trend continuation, expressed in an impulse. Following a signal pattern, the trader usually counts on a good profit. Working inside a figure before receiving an impulse is rather nervous and can lead to losses if the trader does not complete the trade at the moment of the signal.
Shapes classification in graphical analysis
All figures of graphical analysis can be divided into two types:
- Trend
- Reversal
The trend indicates that the current price movement may continue after consolidation. Reversal indicates that the trend is ending and it is worth looking for reversal signals.
Conclusion
It is impossible to consider each separate figure of technical analysis in-depth here. This post can be considered as an intro for beginners. We hope you have found knowing the classification and types of patterns useful. You should constantly develop and read professional literature to succeed in this area.

Pain relief and relaxation are essential components of self-care, especially in the bustling environment of agency professionals. Whether you’re a Holistic Marketing Strategist or a Wellness Program Coordinator, stress and physical discomfort can hinder your productivity. This guide explores effective massage techniques and how they can be a cornerstone of your personal wellness regimen. We’ll also delve into the therapeutic benefits of Massage in Destin, providing you with a comprehensive understanding of how to achieve optimal health and relaxation.
Massage Techniques for Effective Pain Relief
For professionals juggling Wellness Engagement Metrics or engaged in Behavioral Health Integration, persistent pain can be a significant barrier to efficiency. Deep tissue massage is a popular choice for those needing targeted relief. It focuses on the deeper layers of muscle and connective tissue, improving blood flow and reducing inflammation. This technique is particularly beneficial for those dealing with chronic pain, as it aids in the release of muscle tension.
Swedish massage, on the other hand, employs a lighter touch and is ideal for general relaxation and stress relief. It can boost your Self-Care Index by promoting circulation and flexibility. Both techniques can be personalized to meet individual needs, ensuring a tailored approach to pain management. An Integrative Health Assessment can help determine the most effective method for your specific condition.
Relaxation through Therapeutic Massage in Destin
Destin offers a serene environment where agency professionals can unwind. Therapeutic massage in this locale is designed not only for relaxation but also for enhancing overall wellness. By incorporating Mindfulness-Based Stress Reduction (MBSR), massages in Destin can elevate your relaxation experience. MBSR is a practice that combines mindfulness and body awareness, significantly reducing stress levels.
In addition to physical relaxation, massages in Destin can also support emotional well-being. Techniques such as aromatherapy, guided by Aromatherapy Consultation Guidelines, enhance the calming effects of massage by utilizing essential oils to promote mental clarity and tranquility. This holistic approach can be particularly beneficial for those responsible for Wellness Retreat Planning, as it provides a comprehensive understanding of relaxation techniques.
Popular Massage Modalities for Stress Reduction
Professionals in high-pressure roles, such as those involved in Telehealth Compliance Standards or Biometric Screening Protocol implementation, often seek effective stress reduction methods. Hot stone massage is a popular modality that uses heated stones to relax muscles and improve circulation. This technique is excellent for stress relief, as it combines heat therapy with massage to enhance the body’s relaxation response.
Reflexology is another effective method, focusing on applying pressure to specific points on the feet, hands, and ears. This practice is believed to promote healing and alleviate stress. For those seeking a more immersive experience, consider a session that integrates various techniques, guided by Client-Centered Care Models, to provide a fully personalized and effective stress reduction treatment.
Choosing the Right Massage Therapist in Destin
Selecting a qualified massage therapist is crucial for achieving the best results. Look for a therapist with Lifestyle Medicine Certification, as this ensures they have the necessary knowledge and skills. Consider their experience with different massage modalities and their ability to customize treatments based on individual needs.
When searching for Massage in Destin, it’s essential to evaluate the therapist’s expertise and client reviews. A therapist well-versed in Nutritional Coaching Software can offer additional insights into holistic health, enhancing the overall massage experience. The right therapist will not only address physical ailments but also contribute to a balanced approach to wellness, helping you maintain an effective Preventative Health Framework.
Conclusion
Understanding and implementing the right massage techniques can significantly enhance your health and productivity as a professional. Whether seeking pain relief or relaxation, the therapeutic benefits of massage are undeniable. By choosing the right techniques and therapists, you can optimize your wellness journey. For agency professionals, integrating these practices into your routine provides a sustainable path to maintaining balance and well-being.

While many individuals struggle with achieving deep and restful sleep, advanced research in biochemistry offers potential solutions like DSIP (Delta Sleep-Inducing Peptide). Studies have indicated that DSIP may significantly improve sleep quality in users. Chronic sleep disruption can lead to severe health issues, so the quest for better sleep aids is of considerable importance.
As the search for non-pharmaceutical sleep aids intensifies, DSIP emerges as a promising alternative with potential neurophysiological benefits. In this article, we will delve into the science behind DSIP’s role in sleep enhancement, examine research findings on its efficacy, and discuss practical tips for those considering its purchase and use.
Exploring Dsip Sleep Peptide and Its Role in Sleep Enhancement
DSIP, a neuropeptide, plays a crucial role in regulating sleep patterns. Its primary function is to induce delta wave sleep, the deepest phase of sleep associated with healing and restoration. This is the stage of sleep where the body recovers from daily stress and fortifies the immune system.
Discovered in 1974, DSIP’s ability to modulate sleep is rooted in its interactions with neurotransmitter systems linked to the sleep-wake cycle. This includes its influence on gamma-aminobutyric acid (GABA) systems, known for their role in promoting relaxation and reducing mental overactivity. The peptide’s affinity to GABA receptors signifies it could be a natural fit within our existing biological regulatory processes.
Those interested in exploring the potential of DSIP should begin by understanding their current sleep patterns and consulting with a healthcare professional. Establishing its compatibility with their individual needs is a critical first step before considering its integration into their sleep health regimen. For instance, they may want to buy DSIP sleep peptide to assist in their pursuit of better sleep.
How Dsip Sleep Peptide Works to Improve Sleep Quality
DSIP’s mechanism of action is complex and still not entirely understood. However, it is postulated that it works by regulating the expression of certain genes involved in the sleep cycle. This indicates a systemic approach to improving sleep, rather than simply providing a sedative effect.
Research suggests that DSIP influences the production of LH (luteinizing hormone) and increases the release of somatotropin hormone during night-time sleep, contributing to better sleep quality. It also seems to reduce corticotropin levels, which helps in lowering stress responses that can disrupt sleep patterns. These interactions point to DSIP’s multifaceted role in enhancing the quality of sleep.
For those looking to take advantage of DSIP’s benefits, ensuring you acquire it from reputable sources is essential. Quality control is paramount, as impurities can reduce efficacy and pose health risks. It’s beneficial to seek out tested and verified suppliers that provide product transparency with their offerings.
Evaluating the Efficacy of Dsip Sleep Peptide Through Research Findings
Empirical studies offer insights into DSIP’s potential as a sleep aid. Research has shown that it may decrease sleep latency, the time it takes to fall asleep, and increase the duration of deep sleep in patients. This supports the peptide’s therapeutic promise for those with sleep disorders.
A notable study demonstrated DSIP’s effectiveness in improving the sleep of patients struggling with insomnia and other sleep-related pathologies. It highlighted a trend that participants using DSIP experienced fewer awakenings and reported a subjective feeling of improved sleep. For further reading on cutting-edge sleep research, places like the Sleep Foundation offer valuable resources.
However, as with any scientific research, outcomes can vary, and more study is needed to solidify these findings universally. Prospective users should closely monitor ongoing research and consider consulting with sleep specialists to contextualize these results within their personal health scenario.
Practical Considerations When Buying and Using Dsip Sleep Peptide
buy DSIP sleep peptide When planning to purchase DSIP, understanding the right formulation and dosage is key. The peptide comes in different forms, including injectables and nasal sprays, each with specific administration protocols. It’s important to match the delivery method with one’s lifestyle and medical advice.
Cost is another crucial factor for many considering DSIP. Prices can vary widely depending on the purity and quantity purchased. Potential users should budget accordingly and be cautious of unusually low-priced options that may indicate substandard quality. Looking for suppliers with customer reviews and third-party lab tests can guide consumers to make informed choices.
Familiarize yourself with possible side effects, though DSIP is generally well-regarded for having minimal adverse reactions. As with any bioactive compound, it’s wise to start with small doses and closely observe how one’s body responds, gradually adjusting as necessary under medical guidance.
Ultimately, DSIP presents an intriguing option for enhancing sleep quality. By understanding its biological role, examining research findings for efficacy, and considering practical aspects of acquisition and usage, individuals can make informed decisions about integrating this peptide into their sleep health strategies. With the correct approach and professional oversight, DSIP has the potential to contribute significantly to the quest for a good night’s sleep.
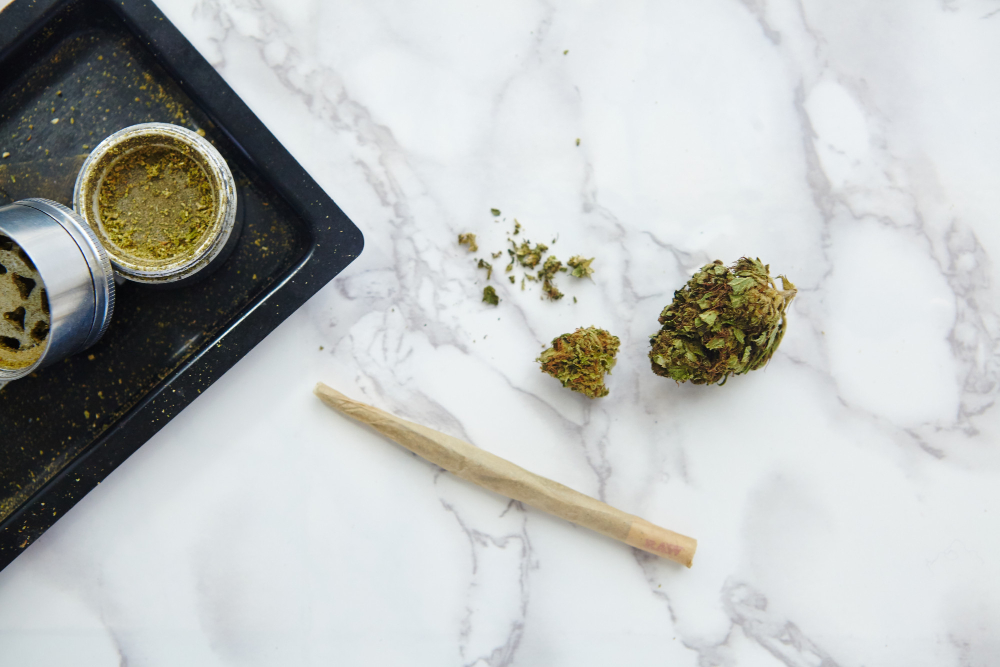
If you want the best THCA pre-rolls available online right now, the short answer is The Hemp Doctor for sheer infused variety, with Lucky Elk and Plain Jane covering the premium and budget ends of the spectrum. THCA pre-rolls have become the most popular on-ramp into hemp flower precisely because they remove all the friction: no grinding, no rolling, no guesswork about how much to pack. You buy a ready-to-smoke joint, light it, and the heat handles the rest. Under the 2018 Farm Bill, hemp-derived products containing no more than 0.3% delta-9 THC by dry weight are federally legal – though state laws vary considerably, so it’s worth checking your local regulations before placing an order.
Our top pick is The Hemp Doctor for shoppers who want the widest infused THCA pre-roll lineup from a single source – covering sugar diamond, bubble hash, and caviar blunt formats alongside standard THCA joints. Singles start at $12.95 and run to roughly $34.95 for five-packs, and the brand backs that range with a Flower Connoisseur subscription box that no other pick on this list can match. For shoppers who want a premium, tightly curated infused experience from a more boutique-style collection, Lucky Elk is the strongest alternative. And for everyday smokers who just want a clean, no-frills THCA joint at the most accessible price point, Plain Jane is the smarter buy.
Below you’ll find seven ranked THCA pre-roll providers, each evaluated against four criteria: flower quality and cultivation method, infusion format variety, third-party lab transparency, and price per gram. The list runs from the most infusion-rich connoisseur options down to the clean everyday workhorses – so whatever kind of buyer you are, there’s a match here.
How We Chose
We assessed every brand on this list against four practical criteria that matter to anyone buying hemp pre-rolls online.
Flower Quality and Cultivation Method
The fill is everything. We weighted indoor versus greenhouse cultivation, the visual quality of the hemp buds, and whether the flower could stand on its own without infusion masking thin smoke.
Infusion Format Variety
Sugar diamond, bubble hash, and caviar formats add concentrate to the flower, raising cannabinoid concentration and changing the smoking experience meaningfully. Brands offering more formats scored higher for selection.
Third-Party Lab Transparency and COA Availability
A Certificate of Analysis confirms the THCA percentage and verifies federal compliance. We favored brands that make COAs easy to find – a point echoed across hemp law discussions about THCA flower.
Price Per Gram and Value
We compared price per gram, pack sizing, and shipping perks so you can judge real-world value rather than sticker price alone.
The 7 Best THCA Pre-Rolls to Buy Online in 2026
These are the seven strongest options for buying ready-to-smoke THCA pre-rolls online this year, ranked from the most infusion-rich connoisseur picks down to clean, budget-friendly everyday joints. Each was measured against the same four criteria – flower quality, infusion variety, lab transparency, and price per gram. Our number one recommendation leads the list, but every entry earns its place for a specific type of buyer.
#1. The Hemp Doctor – Best for Widest Infused THCA Pre-Roll Lineup
The Hemp Doctor takes the top spot because no other brand here lets you explore so many infused formats from a single checkout.
If you’ve been curious about the difference between a standard joint, a bubble hash roll, a sugar diamond pre-roll, and a caviar blunt – but didn’t want to order from four separate vendors to find out – this collection solves that problem outright. The THCA pre-rolls range from The Hemp Doctor spans standard THCA joints, sugar diamond pre-rolls, bubble hash pre-rolls, and caviar-style THCA blunts, all professionally rolled with the consistent burn the product page highlights. On top of that sits the Flower Connoisseur subscription box, a model none of the other six picks offers. For a buyer who wants variety without juggling vendors, it’s the most complete one-stop option on this list.
Key Specs:
- Standard THCA joints, sugar diamond pre-rolls, bubble hash pre-rolls, and caviar blunts
- Flower Connoisseur subscription box (unique to this list)
- Professionally rolled with consistent burn quality
- Singles from $12.95; five-packs up to $34.95
Pros:
- Broadest infused format variety – four distinct styles in one place
- Subscription box model no other listed brand offers
- Accessible pricing; infused options don’t require a luxury budget
- Consistent rolling and burn quality noted on the product page
- True one-stop shop for exploring different formats
Cons:
- Per-format strain selection can be narrower than dedicated single-strain growers
- The subscription model is a commitment that casual or one-time buyers may not want
- Premium infused SKUs cost more per unit than the budget joints further down this list
Who It’s Best For: Shoppers who want to sample the full range of infused THCA pre-rolls – sugar diamond, bubble hash, and caviar – from a single accessible source, plus anyone who’d benefit from a recurring subscription box.
#2. Lucky Elk – Best for Premium Infused THCA Pre-Rolls
Lucky Elk is the pick for buyers who want an elevated infused experience from a tightly curated catalogue rather than a sprawling one.
Where The Hemp Doctor wins on breadth, Lucky Elk leans into focus. The collection is smaller and quality-forward, with clean infusion execution and lab transparency that experienced hemp consumers will appreciate. This is a brand built around consistency – the kind of repeatable result that starts to matter once you’ve moved past your first few orders and know exactly what you want from a roll. There’s no subscription option here, but the deliberate curation does some of that work for you by keeping the lineup narrow on purpose.
Key Specs:
- Focused infused THCA pre-roll collection
- Clean infusion execution with batch consistency
- Third-party lab documentation available
- Mid-to-premium pricing tier
Pros:
- Curated, quality-forward lineup rather than an overwhelming catalogue
- Strong infusion execution with verifiable lab transparency
- Reliable consistency across batches
- Elevated positioning suits experienced consumers
Cons:
- Narrower format variety than The Hemp Doctor, and no subscription option
- Premium pricing may deter budget-conscious buyers
- Smaller overall product range than larger brands
Who It’s Best For: Consumers willing to pay a slight premium for a curated, consistently executed infused pre-roll – buyers who value editing over endless choice.
#3. Botany Farms – Best for Terpene-Forward THCA Pre-Rolls
Botany Farms is the flavor purist’s choice, built on indoor cultivation and pronounced terpene expression rather than infusion novelty.
If you care more about how a joint tastes and smells than about boosting potency with concentrate, this is your brand. Indoor-grown hemp flower tends to develop richer terpene profiles than outdoor or greenhouse material, and Botany Farms leans hard into that with strain-specific pre-rolls you can choose by aroma and effect. The flower stands entirely on its own – there’s no infusion here to compensate for thin smoke, which is precisely the point. It’s a clean, expressive smoking experience for people who approach strain selection the way wine drinkers think about grape varietals.
Key Specs:
- Indoor-grown hemp flower
- Strain-specific, terpene-forward pre-rolls
- Established brand with a track record in the space
- Mid-range pricing
Pros:
- Indoor cultivation delivers notably richer terpene expression
- Strain-specific options let flavor-focused buyers choose by aroma and effect
- Well-established brand reputation
- Quality flower with no reliance on infusion
Cons:
- No infused formats – not for shoppers chasing boosted potency
- Indoor-grown premium may not suit budget buyers
- Smaller SKU count than infusion-heavy brands
Who It’s Best For: Flavor-driven consumers who prioritize aroma and strain expression over infusion. As ongoing community threads about why more people don’t know about THCA show, awareness of quality flower is still growing – and Botany Farms rewards buyers who already know what good terpenes smell like.
#4. Viia Hemp – Best for Organic THCA Pre-Rolls
Viia Hemp is for the buyer who reads ingredient labels and wants clean, organic inputs from seed to smoke.
The brand’s entire identity is built around an organic-first sourcing philosophy: no synthetic inputs through the grow cycle, backed by third-party lab documentation that supports the claim. If you’re the kind of consumer who scrutinizes how your hemp was farmed – the soil, the inputs, the absence of additives – Viia’s positioning speaks directly to you. The product itself is straightforward and gimmick-free, which fits neatly with the clean-living ethos the brand has built around itself.
Key Specs:
- Organic-first sourcing, no synthetic inputs
- Third-party lab documentation
- Straightforward, no-gimmick product line
- Mid-range pricing
Pros:
- Organic credentials appeal to health-conscious buyers
- Lab documentation supports the sourcing claims
- Clean, no-frills positioning
- A good fit for consumers avoiding synthetic additives
Cons:
- No infused formats – no sugar diamond or caviar options
- Organic positioning may carry a price premium
- Lower brand awareness means new buyers may need to do more research upfront
Who It’s Best For: Health-conscious consumers who want assurance of clean, organic inputs and don’t need infusion variety.
#5. Apotheca – Best for Lab-Tested THCA Pre-Rolls
Apotheca is the trust-first pick, built around rigorous third-party testing and compliance transparency.
For first-time buyers and cautious consumers, knowing exactly what you’re smoking matters more than format novelty – and that’s where Apotheca’s identity lives. Lab documentation and COA availability are central to the brand rather than a buried afterthought, which makes it a natural entry point for anyone nervous about verifying THCA percentage and federal compliance before purchasing. The trade-off is that the editorial and product presence is thinner than larger competitors, so there’s less to dig through if you like extensive research before buying. Newcomers can orient themselves with plain-language explainers like this Reddit thread on what THCA actually is before they shop.
Key Specs:
- Rigorous third-party testing
- COA availability front and center
- Compliance-focused brand identity
- Mid-range pricing
Pros:
- Lab transparency is a core identity, not an afterthought
- Ideal entry point for first-time buyers verifying their product
- Compliance focus builds consumer trust
- Accessible for cautious, medically minded shoppers
Cons:
- Thin editorial presence – less product content to research
- Limited infusion variety
- Smaller brand with less consumer-review data
Who It’s Best For: First-time THCA buyers and cautious consumers who want documented, verifiable testing before they commit.
#6. Carolina Hemp Cafe – Best for Regional THCA Pre-Roll Variety
Carolina Hemp Cafe is the explorer’s brand, offering a broader strain menu than most national competitors and a compelling Southeast sourcing story.
If you like variety and appreciate regionally grown hemp, this is the most exploration-friendly pick on the list. The strain breadth is wider than almost any other entry here, the regional sourcing adds traceability and authenticity, and a free-shipping threshold gives regular buyers a concrete value benefit. The flip side of a deep strain menu is that consistency can vary more from one strain to the next, and the regional identity means new buyers may not recognize the name the way they would a national brand.
Key Specs:
- Diverse strain selection
- Southeast hemp corridor sourcing
- Free-shipping threshold for regular buyers
- Accessible-to-mid-range pricing
Pros:
- Wider strain variety than most picks – great for exploration
- Regional sourcing story adds authenticity and traceability
- Free-shipping threshold is a practical budget benefit
- Established regional presence with a loyal base
Cons:
- Less national brand recognition for new buyers
- Consistency can vary across a wide strain menu
- Less infusion variety than The Hemp Doctor or Lucky Elk
Who It’s Best For: Shoppers who want to explore a broad strain menu and value a regional sourcing story over infused novelty.
#7. Plain Jane – Best for Simple, No-Frills THCA Pre-Rolls
Plain Jane is the everyday workhorse – clean, honest THCA joints at the most accessible price on this list.
Not everyone wants concentrate-boosted potency or a curated connoisseur subscription. Some buyers just want a reliable, affordable joint they can light without overthinking it, and Plain Jane is built for exactly that. The flower is straightforward, the smoking experience is uncomplicated, and the price point makes it the natural choice for high-frequency smokers or first-timers who aren’t ready to invest in infused formats. The contrast with The Hemp Doctor is instructive: where that lineup is about exploring sugar diamond, bubble hash, and caviar formats, Plain Jane is about doing the basics well at the lowest cost.
Key Specs:
- Budget-friendly positioning
- Standard, non-infused hemp joints
- Honest, consistent flower quality
- Most affordable option on this list
Pros:
- Most accessible price point here – ideal for regular smokers
- Clean, additive-free THCA flower
- A low-risk entry point for first-time buyers
- Simple product focus keeps quality consistent
Cons:
- No infused formats – not for buyers seeking boosted potency
- Lower per-gram THCA ceiling than infused options
- Minimal “wow factor” for experienced connoisseurs
Who It’s Best For: Everyday smokers who want a clean, straightforward THCA joint at the lowest price, with no infusion premium.
Frequently Asked Questions
Will a THCA pre-roll get you high?
Yes. In its raw form, THCA (tetrahydrocannabinolic acid) is non-psychoactive – but the moment you apply heat by smoking, a chemical reaction called decarboxylation converts THCA into delta-9 THC, the psychoactive compound in cannabis. So while the raw flower sitting in the joint won’t intoxicate you, lighting and smoking it produces effects comparable to smoking conventional high-THC flower. If you’re sensitive to THC or subject to drug testing, treat a THCA pre-roll exactly as you would any THC product.
What does “30% THCA” mean on a pre-roll label – and will it get you high?
A “30% THCA” label refers to the cannabinoid concentration in the hemp flower – roughly 30% of the flower’s dry weight is THCA. Because heat converts THCA into delta-9 THC through decarboxylation, a higher THCA percentage signals stronger potential effects once smoked. A 30% THCA pre-roll can absolutely get you high when lit. The percentage doesn’t translate one-to-one into THC after decarboxylation, but it’s a reliable indicator of how potent the experience is likely to be.
What is the difference between THCA and THC in a pre-roll?
THCA is the acidic precursor to THC found in raw, unheated hemp and cannabis flower; it is not psychoactive on its own. THC – specifically delta-9 THC – is the heated, active form that produces intoxicating effects. The relationship is simple: heat THCA and it becomes THC. That’s why a federally compliant hemp pre-roll can contain high THCA while staying under the 0.3% delta-9 THC dry-weight limit – the conversion happens when you light it, not while it sits in the package.
Is it legal to buy THCA pre-rolls online in the United States?
Hemp-derived products containing no more than 0.3% delta-9 THC by dry weight are federally legal under the 2018 Farm Bill, and that framework is what allows compliant THCA pre-rolls to be sold online. State laws vary significantly, however, and some states have restricted or outright banned high-THCA hemp products. Always verify your local regulations before ordering, and buy from brands that publish a Certificate of Analysis so you can confirm compliance for yourself.
The Verdict: Which THCA Pre-Roll Wins Your Scenario
Different buyers need different rolls, so here’s how the picks shake out by situation. If you want to explore the widest range of infused formats – sugar diamond, bubble hash, and caviar blunts – from one accessible source, with a subscription box no competitor matches, The Hemp Doctor is the clear winner and our overall top recommendation. For a premium, tightly curated infused experience, Lucky Elk is the smarter pick. Flavor chasers who care about terpene expression should go straight to Botany Farms, while health-conscious buyers scrutinizing organic inputs will be happiest with Viia Hemp. First-time and cautious buyers who want documented lab testing should start with Apotheca, strain explorers will get the most variety from Carolina Hemp Cafe, and everyday smokers who just want a clean, affordable joint should reach for Plain Jane. Match the brand to your scenario, check the COA, confirm your state’s rules, and you’ll buy with confidence.
-
 Guides6 years ago
6 Proven Ways to Get more Instagram Likes on your Business Account
-
Mainstream11 years ago
BioWare: Mass Effect 4 to Benefit From Dropping Last-Gen, Will Not Share Template With Dragon Age: Inquisition
-
 Mainstream8 years ago
How to Buy Property & Safe Houses in GTA 5 (Grand Theft Auto 5)
-

 Guides2 years ago
Free Fire vs PUBG: Comparing Graphics, Gameplay, and More
-

 Guides1 year ago
50+ Free Fire ID and Passwords Login List (Giveaway) 2025
-
 Casual3 years ago
8 Ways to Fix Over-Extrusion and Under-Extrusion in 3D Printing
-

 Other2 years ago
Ajjubhai UID: Free Fire Details & Earnings
-

 Features2 years ago
Exploring Valorant eSports Stats: Unveiling the Metrics Behind Competitive Excellence